

Table of Contents
A version of the S&P 500 that cuts out artificial intelligence stocks briefly beat the main index this year. It now trades neck-and-neck as funds shift cash into defensive sectors.
A Goldman Sachs index tracking the S&P 500 without AI firms gained 12.4 percent through Oct. 22. That beat the standard S&P 500 gain of 12.0 percent. The two gauges now run close together following tech rallies this week.
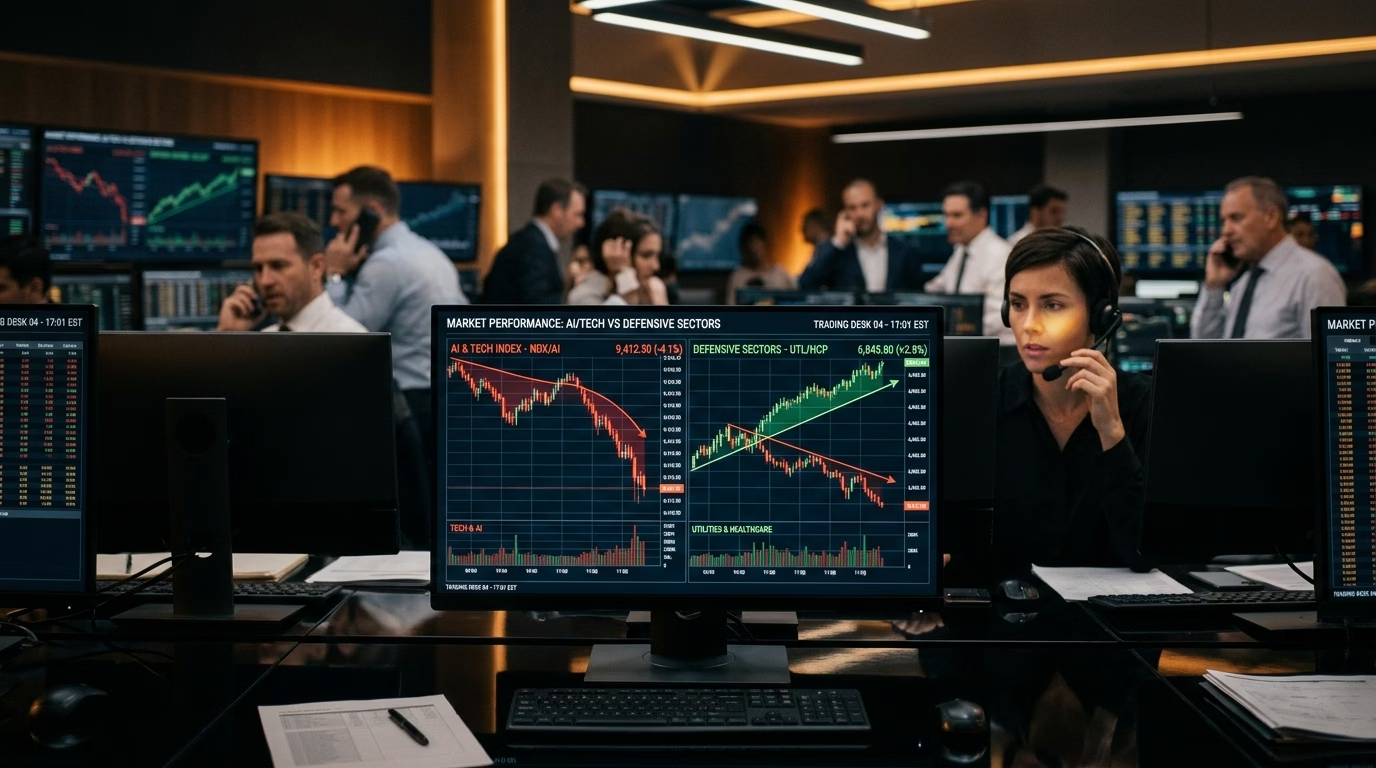
Tech and AI stocks make up roughly 45 percent of the standard S&P 500. That heavy weighting lifted the market for years. Yet heavy tech exposure turned into a drag this month. The S&P tech sector dropped about 7 percent while older sectors held steady.
- Ex-AI Index Milestone: Goldman Sachs’s S&P 500 ex-AI index gained 12.4 percent, briefly overtaking the standard benchmark’s 12.0 percent advance.
- 45% Tech Concentration: Tech and AI-linked equities comprise nearly half the S&P 500, transforming a multi-year growth engine into an index-wide drag.
- Capex Fatigue: Investors penalized heavy spenders, knocking Meta down 7 percent over elevated data center capex while cloud debt in CoreWeave and Oracle struggled.
- Power & Gear Sell-off: Hardware and utility infrastructure providers like GE Vernova, Bloom Energy, and Vistra suffered steep market declines.
- Defensive Inflows: Capital rotated into utilities, consumer staples, and healthcare, with sector funds rising 7 to 10 percent this month.
Comparison: Standard S&P 500 vs. Goldman Sachs S&P 500 Ex-AI
| Index Metric | Standard S&P 500 | Goldman Sachs S&P 500 Ex-AI |
|---|---|---|
| Year-to-Date Return | +12.0% (through late October) | +12.4% (through Oct. 22) |
| Tech & AI Weighting | ~45.0% of total index cap | 0.0% (Excluded by methodology) |
| Monthly Tech Sector Trend | Down ~7.0% this month | Insulated from tech pullbacks |
| Top Sector Drivers | Stalled by chip pullbacks | Utilities (+10%), Staples (+7%), Healthcare (+8%) |
| Capex & Hardware Risk | High exposure to data center debt | Zero direct exposure to GPU capex cycles |
| Methodology Base | Cap-weighted across 500 firms | S&P 500 minus AI enablers, re-weighted |
The 45 Percent Tech Drag and Infrastructure Capex
Investors pushed back against heavy debt and high spending. Shares of Meta Platforms fell nearly 7 percent after leaders shared plans for bigger data center bills and new share sales. Markets also cooled on debt sold by cloud hosts like CoreWeave and Oracle.
Firms selling power and gear to data centers faced sharp drops. Shares in GE Vernova, Bloom Energy, Vistra, and Quanta Services fell across recent trading sessions.
This hardware fatigue matches recent moves across compute markets. As cloud debt mounted, startups launched tradable GPU futures to hedge compute risks. Economists at Apollo also noted that AI has produced zero financial payoff outside a few hardware suppliers, prompting funds to re-examine balance sheets.
Goldman Sachs built the index with S&P Dow Jones Indices. The model starts with the full S&P 500. It removes firms labeled as AI enablers. It then applies standard weights to the remaining firms.
Capital Rotates to Defensives and Non-Tech Compounders
The ex-AI index trailed the broader market for most of the year. Yet the gap closed fast this month. Investors moved cash into defensive funds. Sector funds tracking Consumer Staples (XLP), Health Care (XLV), and Utilities (XLU) gained 7 to 10 percent this month.
Some analysts urge clients to stay with non-AI stocks for safety. Oppenheimer analyst Ari Wald said the market pendulum swung back toward non-AI assets in late October. Oppenheimer favors business services and insurance, highlighting firms like Republic Services, Cintas, Verisk Analytics, and MetLife.
Berkshire Hathaway gained 8 percent this month from this rotation. The firm owns steady cash makers like Geico alongside a $364 billion stock portfolio. In health care, Eli Lilly rose 22 percent on weight-loss treatments with new drug filings set for 2027. Cruise firm Viking Holdings also stayed strong, with firm travel bookings extending into 2027.
This defensive flight mirrors international shifts. In Asia, China’s AI sector lost $2.4 trillion as hardware export bans tightened and domestic consumption weakened. While private capital fuels mega offerings like the Anthropic IPO filing, public equity investors are demanding proven cash flows over multi-billion-dollar capex promises.
Frequently Asked Questions
What is the Goldman Sachs S&P 500 ex-AI index?
It is an index created by Goldman Sachs and S&P. It tracks S&P 500 companies while removing firms labeled as artificial intelligence enablers.
Why did non-AI stocks catch up to the S&P 500?
Tech stocks make up 45 percent of the S&P 500 and fell 7 percent this month. At the same time, investors moved money into defensive sectors like utilities and healthcare.
Which companies are considered AI enablers?
AI enablers include chipmakers, cloud server builders, and power vendors. Companies like Nvidia, CoreWeave, and Meta fall into this group due to massive hardware spending.
Why are investors concerned about AI spending?
Investors worry that tech giants spend billions on chips and data centers before seeing steady software profits. Rising debt and high costs squeeze profit margins.
Analyzing financial datasets, quantitative trading weights, or portfolio schemas? Convert and validate your structured data with TeckScaler’s free client-side JSON to YAML Converter.
📊 Building Fintech Data Pipelines or Algorithmic Analytics Tools?
TeckScaler engineers resilient cloud data architectures, real-time analytics engines, and modern full-stack web applications. Consult with our engineering leads →
🔗 Related Market & Technology Analysis
- Hyperbolic Builds Tradable GPU Futures to Hedge AI Risk: How ex-Citadel quants created spot markets for compute power.
- AI Has Zero Financial Payoff Outside Tech Says Apollo: Wall Street research on corporate AI capex and shareholder returns.
- China AI Stocks Drop $2.4T: STAR 50 Plunges 40%: Asia’s tech valuation crash amid weak domestic consumption and US bans.
Primary Sources: CNBC: S&P 500 ex-AI Index Data | Goldman Sachs Global Equity Research | Oppenheimer Technical Strategy Note | S&P Dow Jones Indices




[…] risks. Meanwhile, public equity markets are rotating into steady cash generators, as seen when the S&P 500 ex-AI index matched benchmark returns while investors shifted into defensive utilities and […]
[…] S&P 500 Ex-AI Index Pulls Ahead as Investors Rotate Out of Tech […]